Race to Lead Demographics

2016-2019-2022

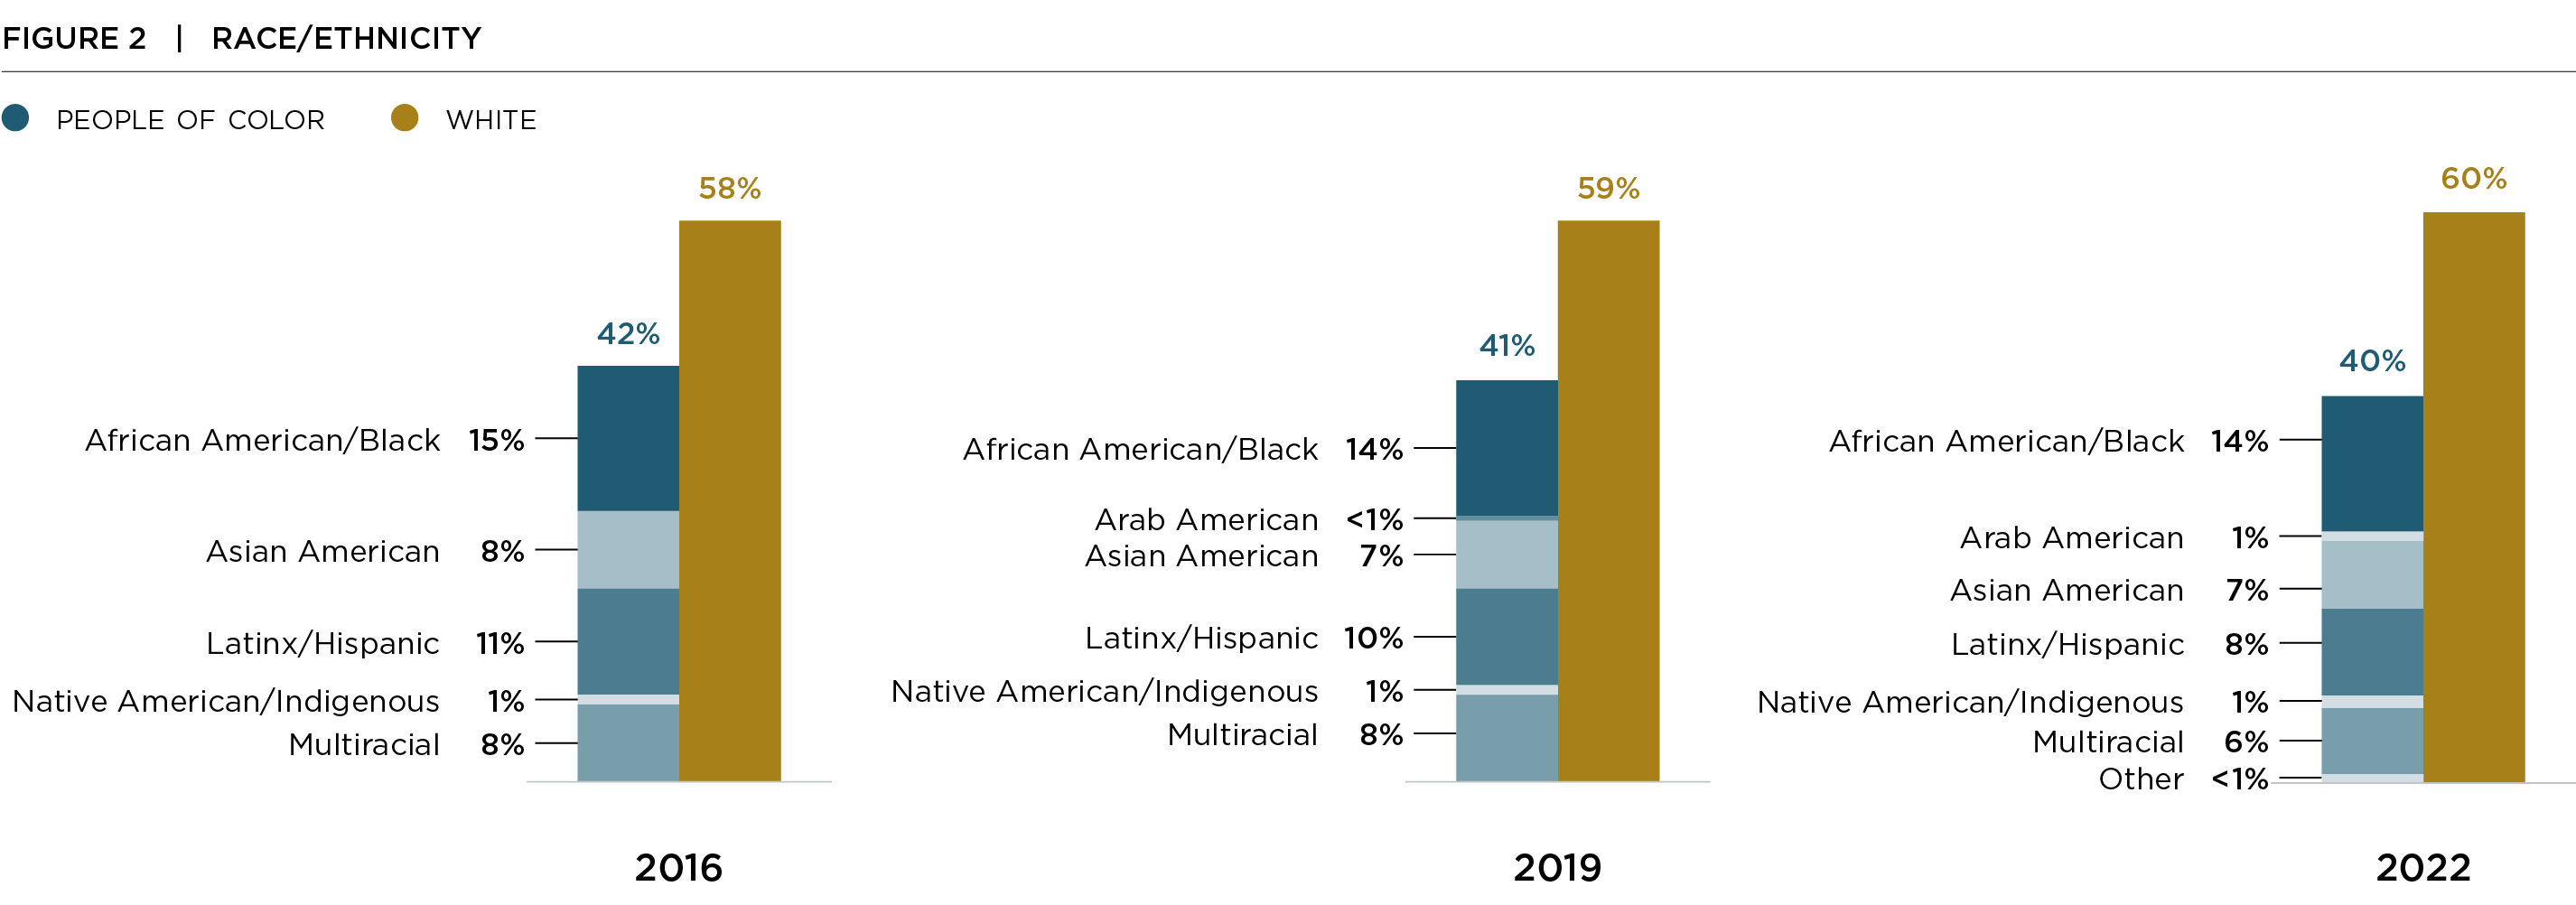
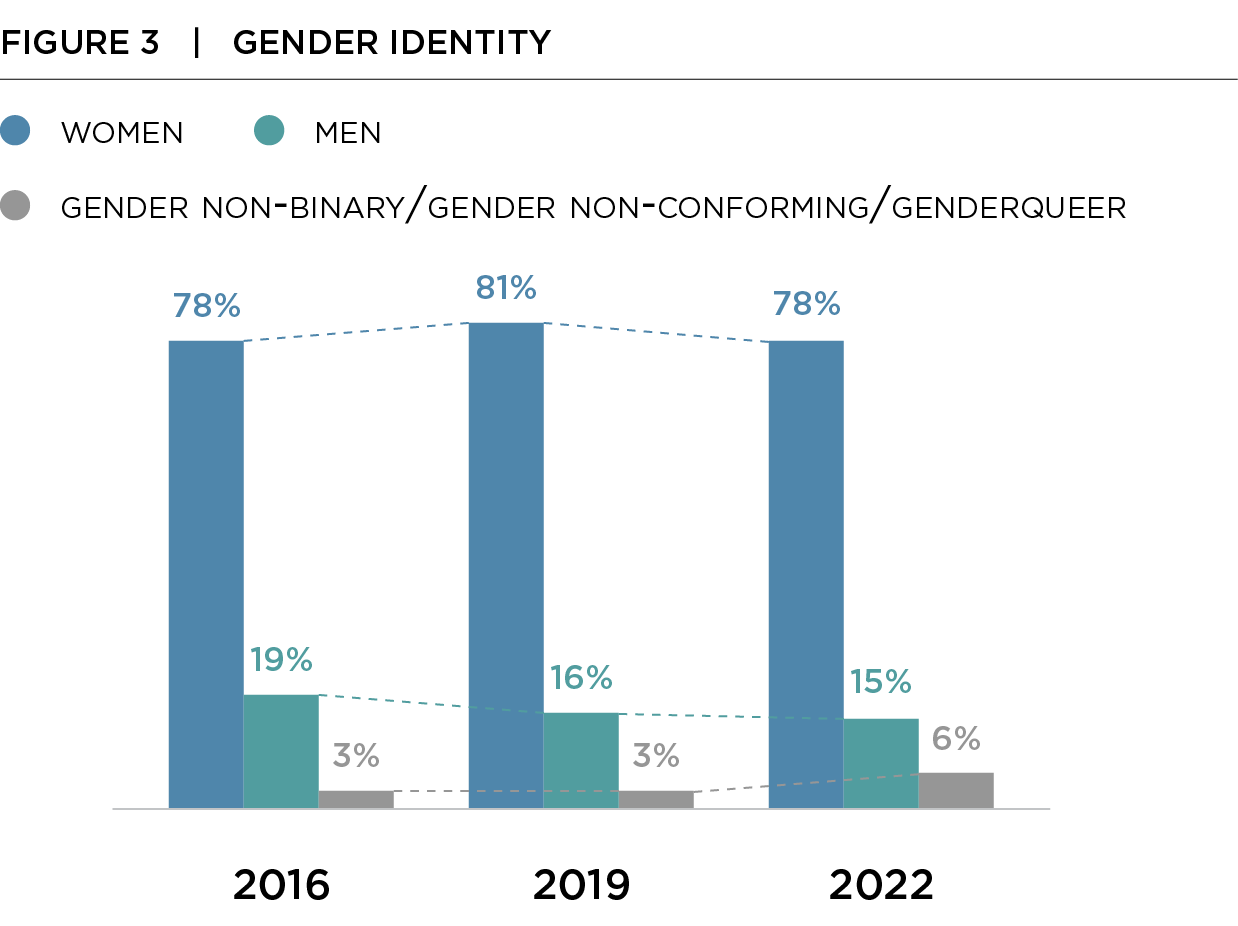
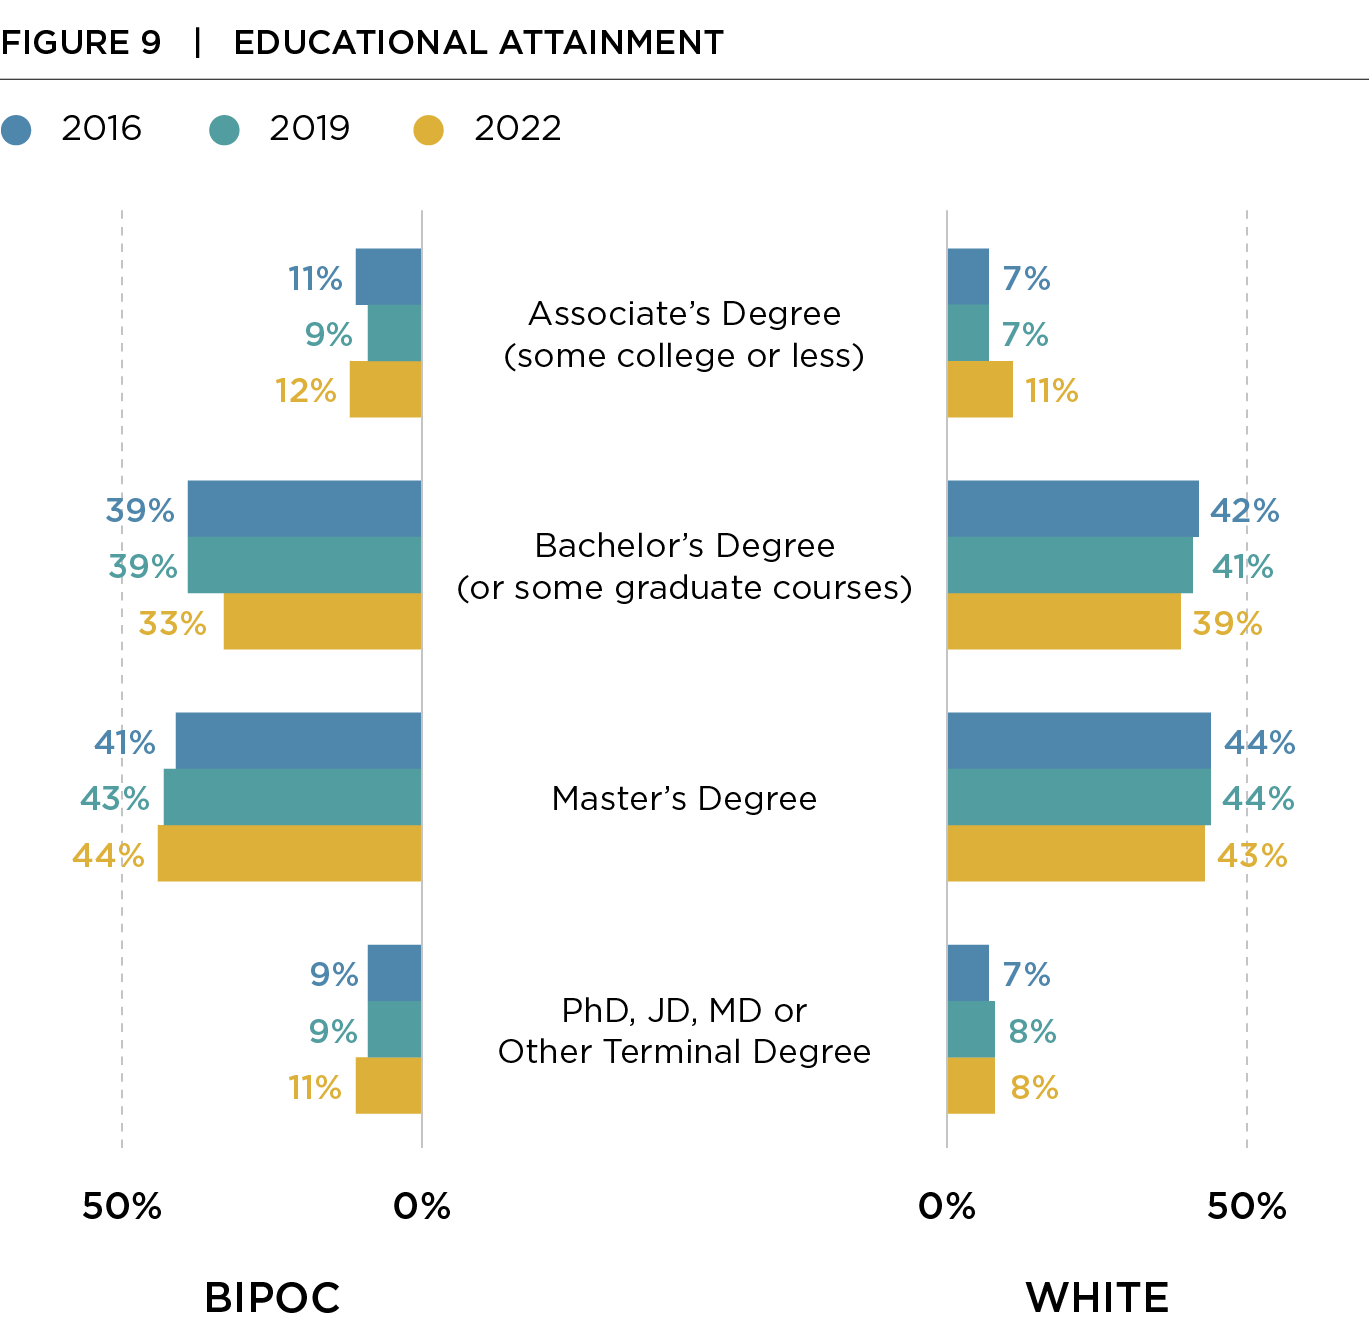
This brief highlights the composition of the sample of respondents to the Building Movement Project’s Race to Lead surveys in 2016, 2019, and 2022. The 2022 survey sample likely includes people who answered previous iterations of the survey in 2016 and/or 2019, alongside first-time respondents.

Key Findings

Featured Data

Respondents came from all 50 states and the District of Columbia.

Recent News

Pushed into Leadership, Hung Out to Dry
Nonprofit Quarterly

For over two decades the Building Movement Project (BMP) has been documenting the experience of leaders of color in the nonprofit sector. A new report titled The Push and Pull:...

Fewer People Want to Lead Nonprofits. What’s the Answer?
The Chronicle of Philanthropy

Building Movement Project’s Co-Executive Directors explore our latest report in the Race to Lead series which finds that aspiring leaders, especially those of color, aren’t being pulled into leadership through...

With Crisis Comes Change: Black Women and the Glass Cliff
The Dorothy A. Johnson Center for Philanthropy

First published in the 11 Trends in Philanthropy for 2024 report, this article features Building Movement Project’s Race to Lead research and uncovers some of the challenges and opportunities of...

Download Brief

Access the data, analysis,
and recommendations.

Download Brief

Join the Conversation

Help shift the narrative about race and leadership in the nonprofit sector. Tell your story and share the #racetolead reports today.

Citations

Constantine, Tessa, Frances Kunreuther and Sean Thomas-Breitfeld (2024). Race to Lead Demographics: 2016-2019-2022.